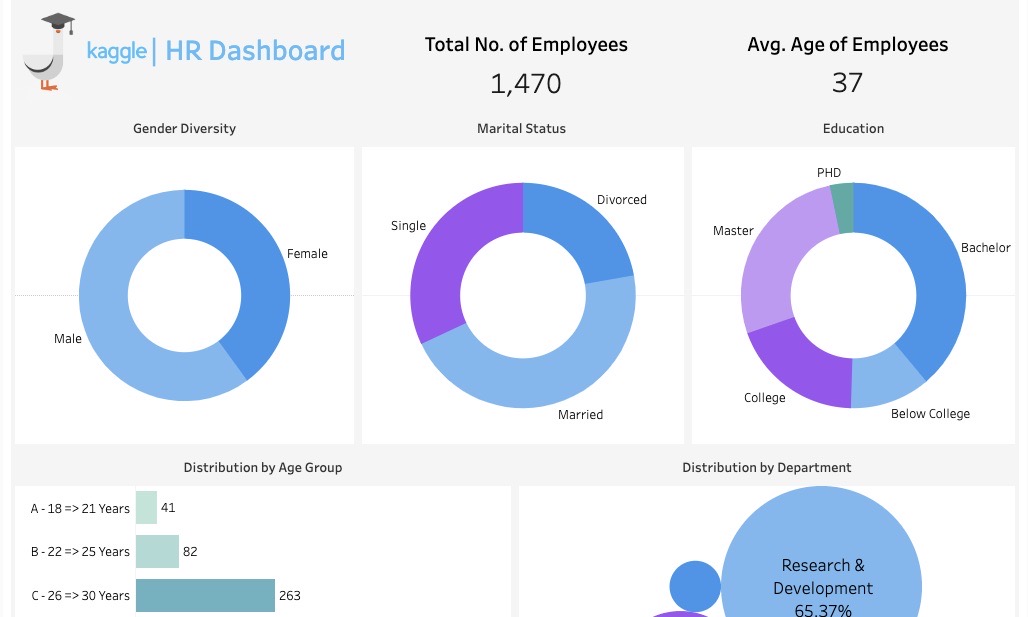
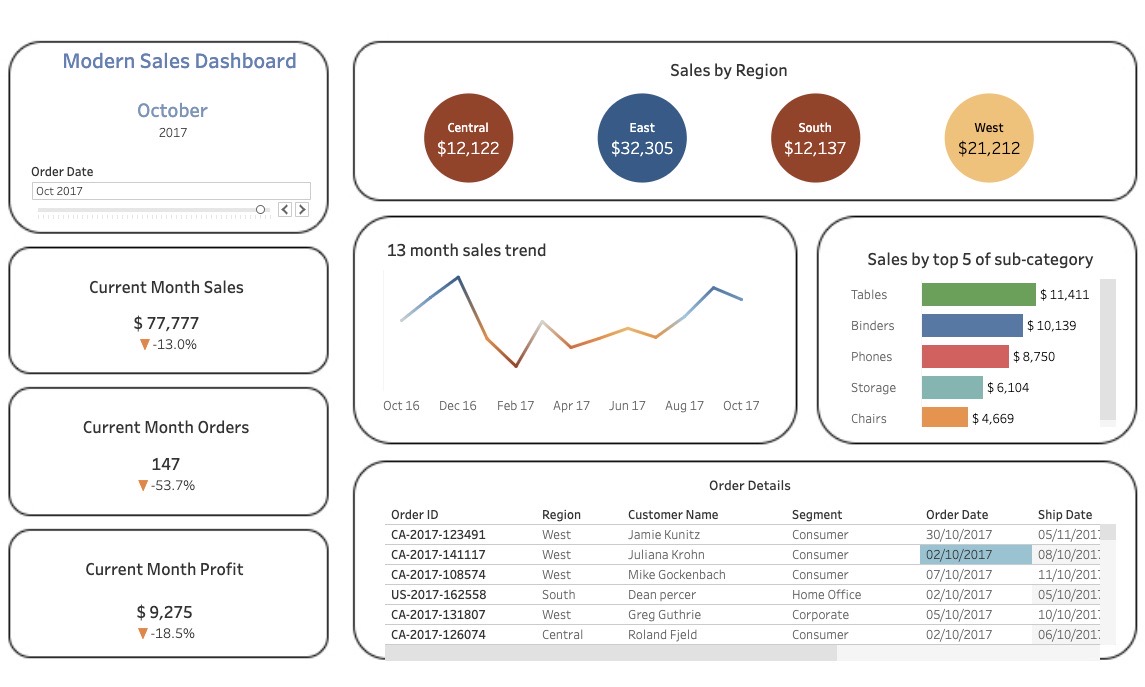
BI Dashboard
Below are screenshots of reports/dashboards I made with BI tools (PowerBI/Tableau)
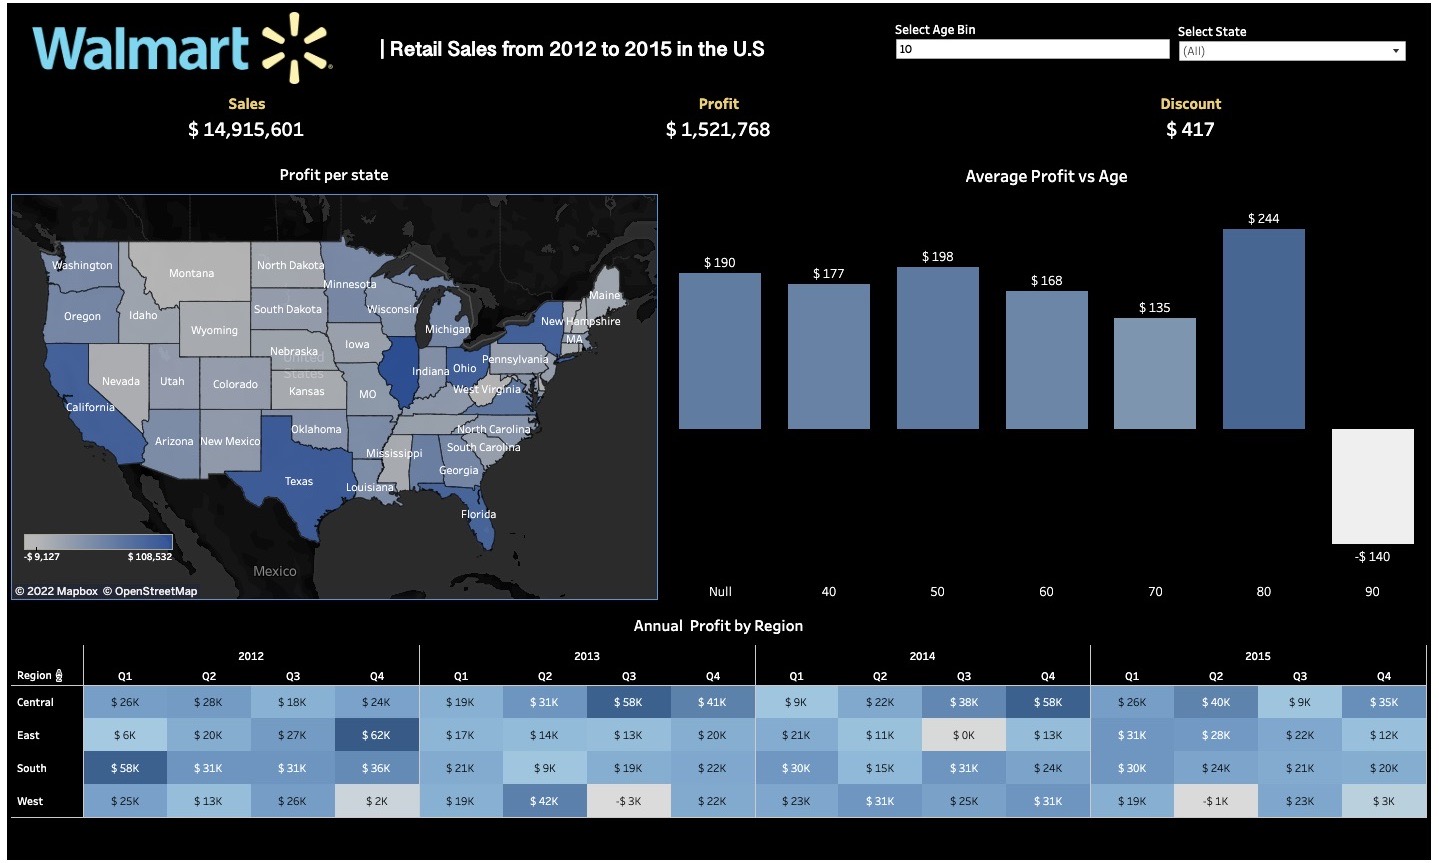
Using SQL to explore Sales data on Black Friday

Sales insights were explored by using different SQL expressions. For example:
- Number of purchases from each city
- Details of Top 10 male customers having large purchases
- The most purchased product of every city
- ...
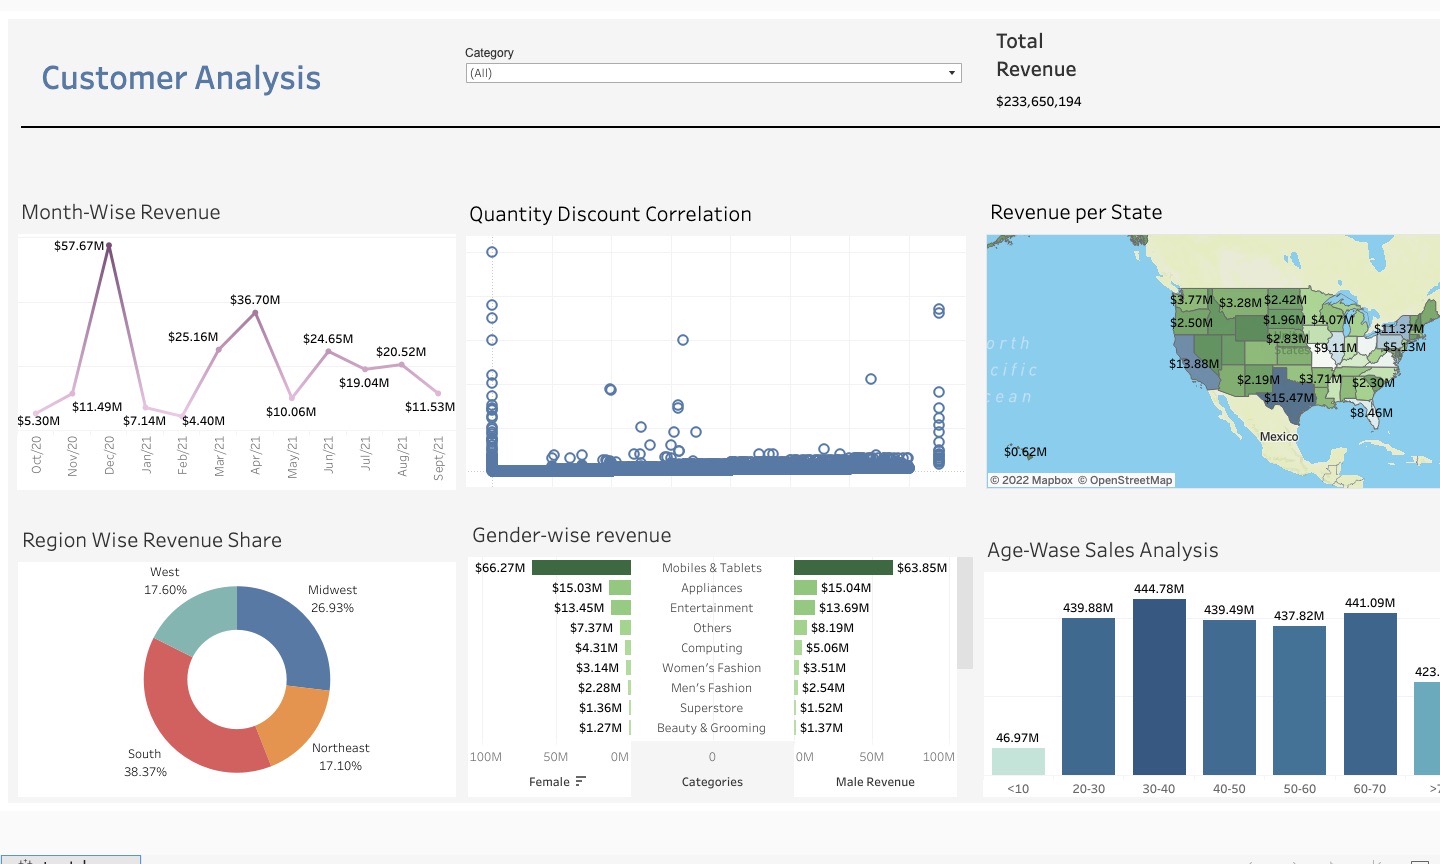
Market Segmentation (Python)

This project uses dataset from a retail store to identify customer groups for marketing strategy planning. Below are the specific objectives:
- Identify and visualize customer profiles in general, and by gender
- Use k-mean cluster analysis to divide customers groups and depict profiles based on demographic information
- Suggest business/marketing strategies
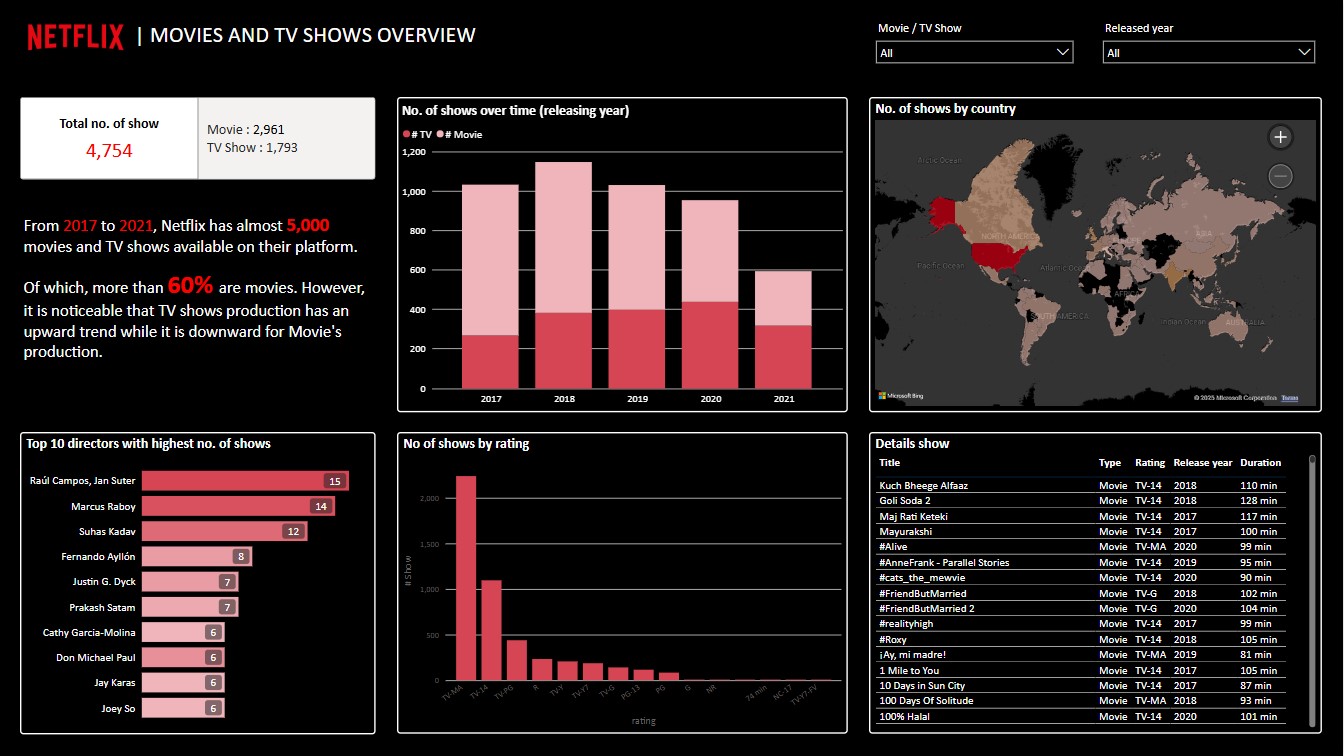
Exploratory Data Analysis (EDA)
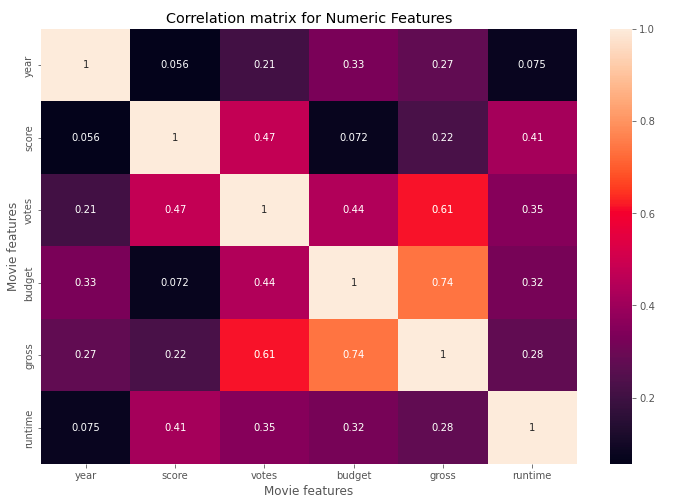 Is the movie industry dying? Is Netflix the new entertainment king?
This project used Python to assess movie revenue over the last decade.
Results show that the number of votes and movie budget have correlations with gross revenue.
Keywords: Pandas, NumPy, Seaborn, Matplotlib
Is the movie industry dying? Is Netflix the new entertainment king?
This project used Python to assess movie revenue over the last decade.
Results show that the number of votes and movie budget have correlations with gross revenue.
Keywords: Pandas, NumPy, Seaborn, Matplotlib
Amazon Web Scraping using Python
Data scraping isn't something only for programmer or software engineer; we, analysts, can do it too using BeautifulSoup and Requests libraries. This project is a case study scraping data of an interesting book from Amazon.
Linear Regression Analysis using R
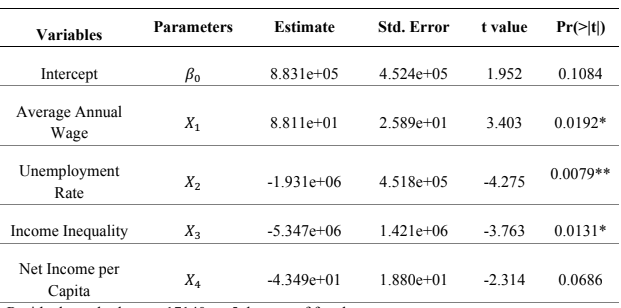
Italy is one of the most alternative locations for migrants as well as the entry gate to reach other European countries. In this project, I examined determinants of international migration in this country.